9 Backend Performance Bottlenecks Developers Often Ignore
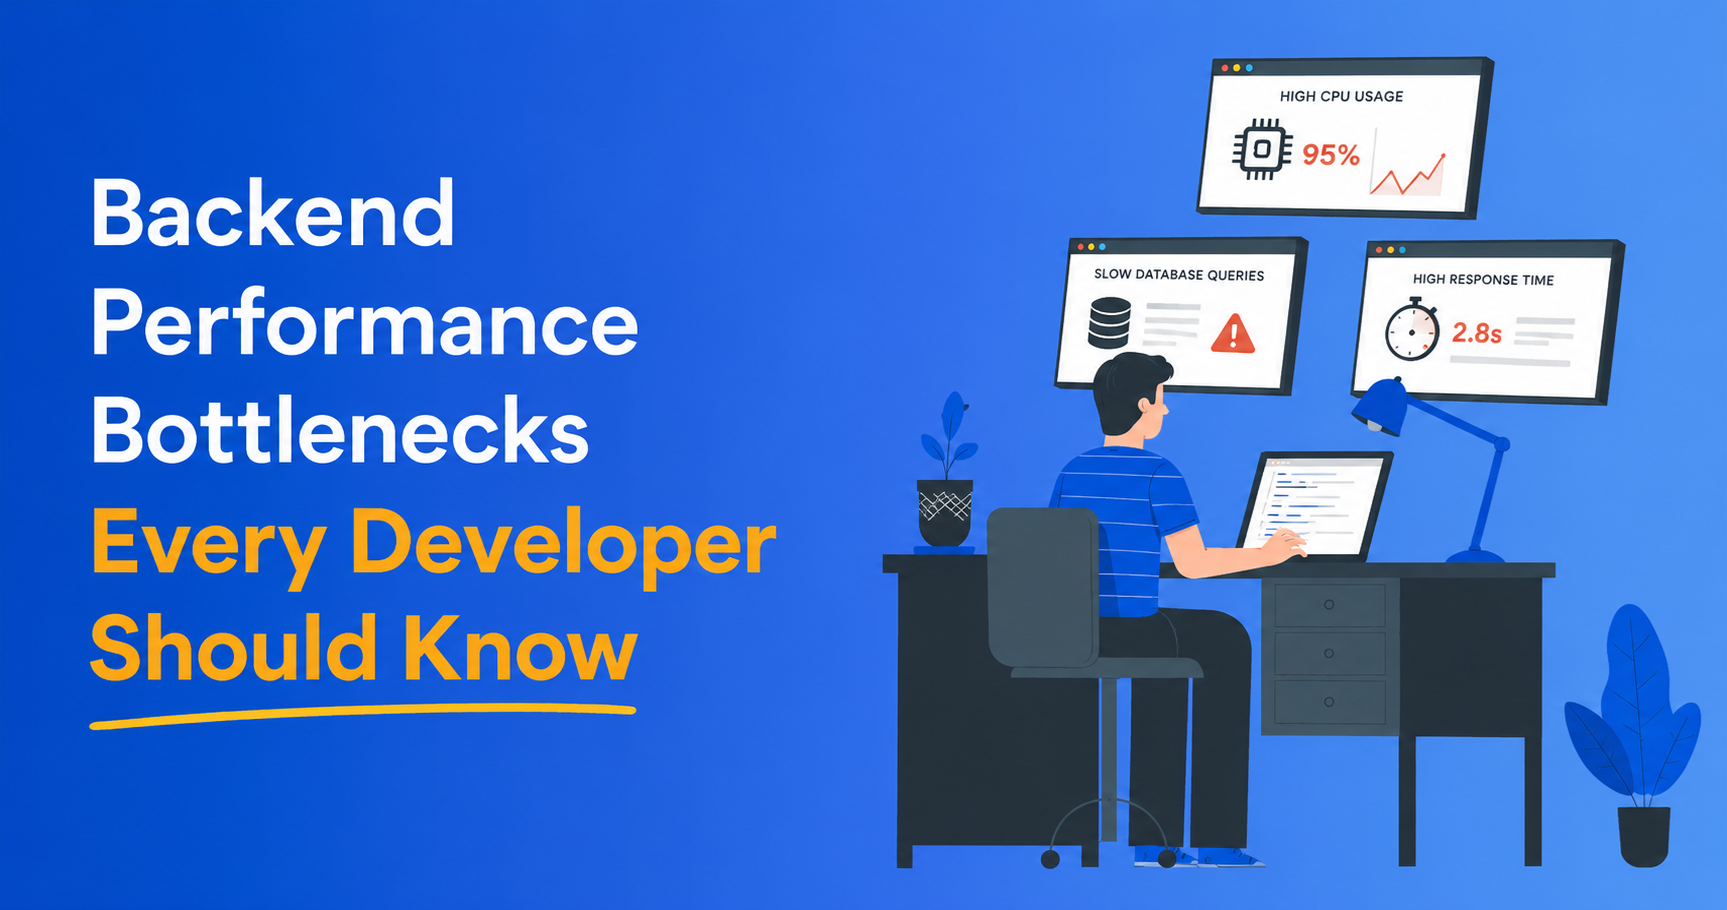
Backend systems rarely fail because of one dramatic defect. Performance usually degrades through small inefficiencies that remain invisible in development and multiply under production traffic. Slow queries, blocked threads, stale caches, retry storms and memory growth can increase latency and infrastructure cost long before an outage occurs.
The following bottlenecks deserve continuous monitoring in modern APIs, distributed systems and AI-enabled platforms.
- N+1 Queries Multiply Database Load
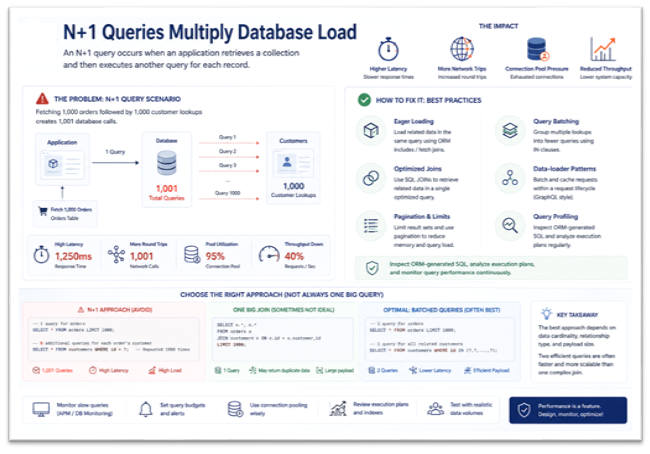
An N+1 query occurs when an application retrieves a collection and then executes another query for each record.
Fetching 1,000 orders followed by 1,000 customer lookups creates 1,001 database calls. The result is higher latency, additional network round trips and connection-pool pressure.
Developers should inspect ORM-generated SQL and use:
- Eager loading
- Query batching
- Optimized joins
- Data-loader patterns
- Pagination and result limits
- Query profiling
The objective is not always one large query. Two efficient batched queries may perform better than a complex join, depending on data cardinality and payload size.
- Poor Caching Creates Stale Data and Stampedes
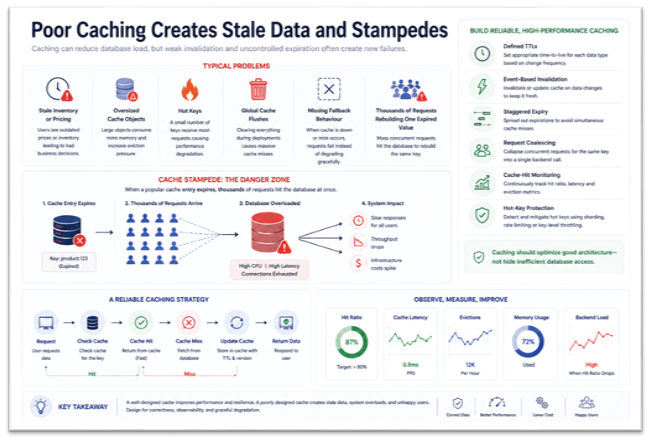
Caching can reduce database load, but weak invalidation and uncontrolled expiration often create new failures.
Typical problems include:
- Stale inventory or pricing
- Oversized cache objects
- Hot keys
- Global cache flushes
- Missing fallback behaviour
- Thousands of requests rebuilding one expired value
That final scenario is a cache stampede. It can overload the database within seconds.
Reliable caching requires defined TTLs, event-based invalidation, staggered expiry, request coalescing, cache-hit monitoring and protection against hot-key concentration.
Caching should optimize good architecture—not hide inefficient database access.
3. Sequential API Calls Increase Tail Latency
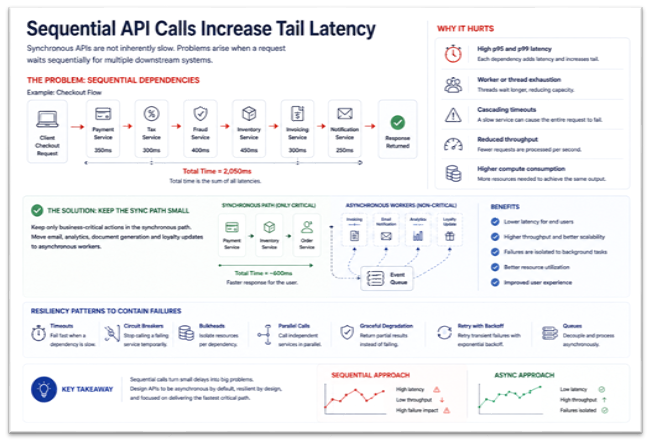
Synchronous APIs are not inherently slow. Problems arise when a request waits sequentially for multiple downstream systems.
A checkout operation might call payment, tax, fraud, inventory, invoicing and notification services. Even moderate latency in each dependency can push total response time into several seconds.
This causes:
- High p95 and p99 latency
- Worker or thread exhaustion
- Cascading timeouts
- Reduced throughput
- Higher compute consumption
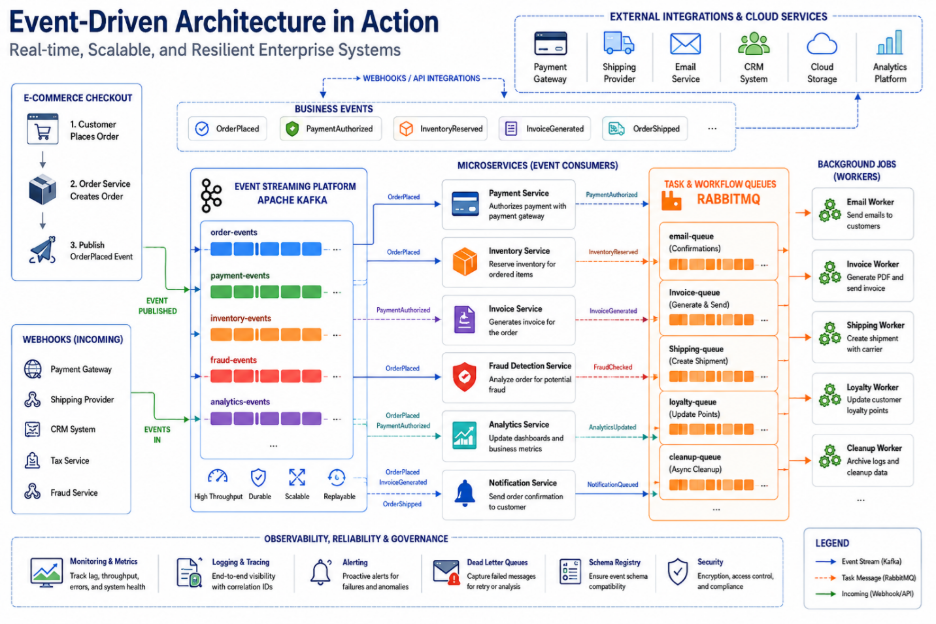
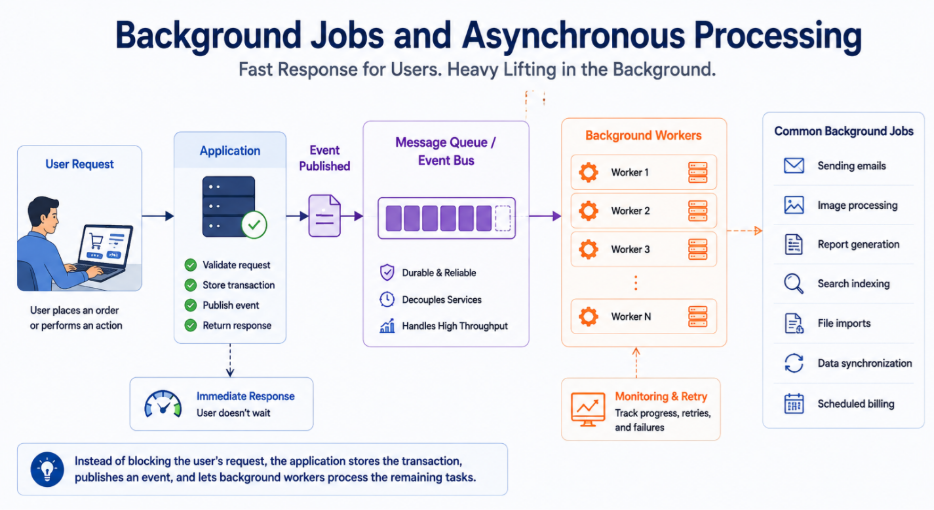
Keep only business-critical actions in the synchronous path. Move email, analytics, document generation and loyalty updates to asynchronous workers.
Use timeouts, circuit breakers, bulkheads, parallel calls, queues and graceful degradation to contain failures.
- Connection-Pool Exhaustion Is Easy to Misdiagnose
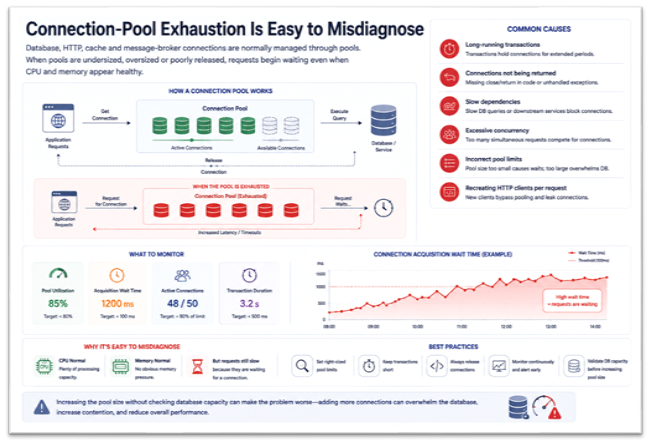
Database, HTTP, cache and message-broker connections are normally managed through pools. When pools are undersized, oversized or poorly released, requests begin waiting even when CPU and memory appear healthy.
Common causes include:
- Long-running transactions
- Connections not being returned
- Slow dependencies
- Excessive concurrency
- Incorrect pool limits
- Recreating HTTP clients per request
Monitor pool utilization, acquisition wait time, active connections and transaction duration. Increasing the pool size without checking database capacity can make the problem worse.
5. Large AI Contexts Increase Cost and Latency
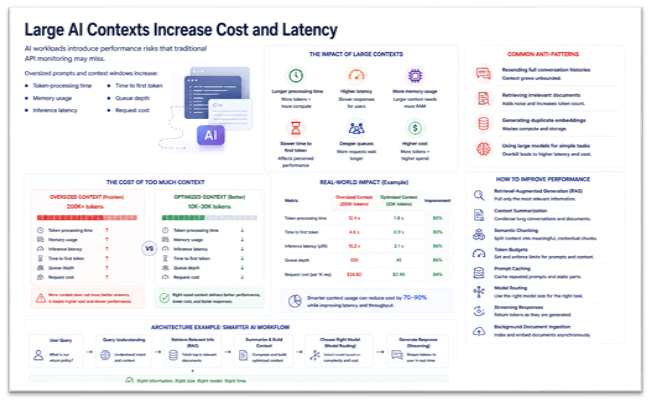
AI workloads introduce performance risks that traditional API monitoring may miss.
Oversized prompts and context windows increase:
- Token-processing time
- Memory usage
- Inference latency
- Time to first token
- Queue depth
- Request cost
Common anti-patterns include resending full conversation histories, retrieving irrelevant documents, generating duplicate embeddings and using large models for simple tasks.
Improve performance through:
- Retrieval-augmented generation
- Context summarization
- Semantic chunking
- Token budgets
- Prompt caching
- Model routing
- Streaming responses
- Background document ingestion
Relevant context is more valuable than maximum context.
6. Poor Indexing Slows Reads—or Writes
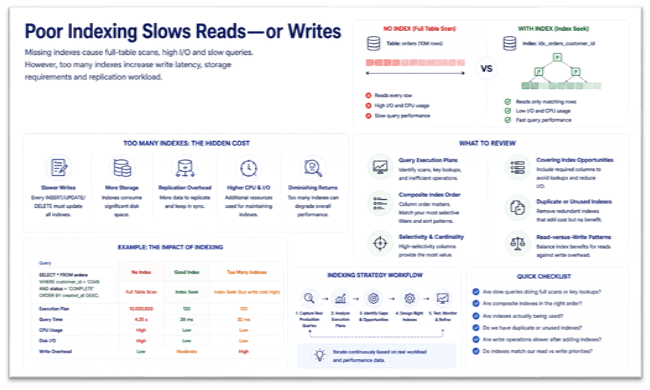
Missing indexes cause full-table scans, high I/O and slow queries. However, too many indexes increase write latency, storage requirements and replication workload.
Review:
- Query execution plans
- Composite index order
- Selectivity and cardinality
- Covering-index opportunities
- Duplicate or unused indexes
- Read-versus-write patterns
Indexes should be designed from real production queries, not assumptions made during initial development.
7. Webhook Retry Storms Cause Cascading Failures
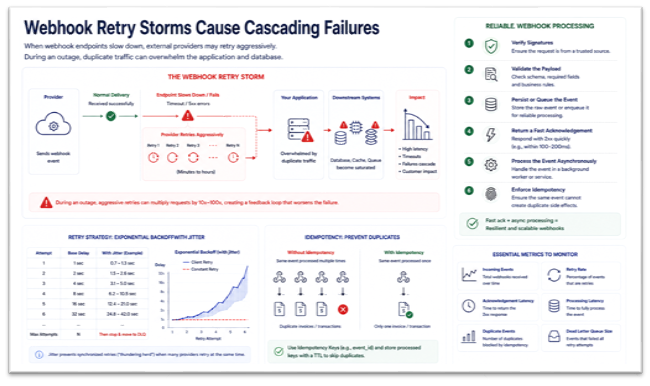
When webhook endpoints slow down, external providers may retry aggressively. During an outage, duplicate traffic can overwhelm the application and database.
Reliable webhook processing should:
- Verify signatures.
- Validate the payload.
- Persist or queue the event.
- Return a fast acknowledgement.
- Process the event asynchronously.
- Enforce idempotency.
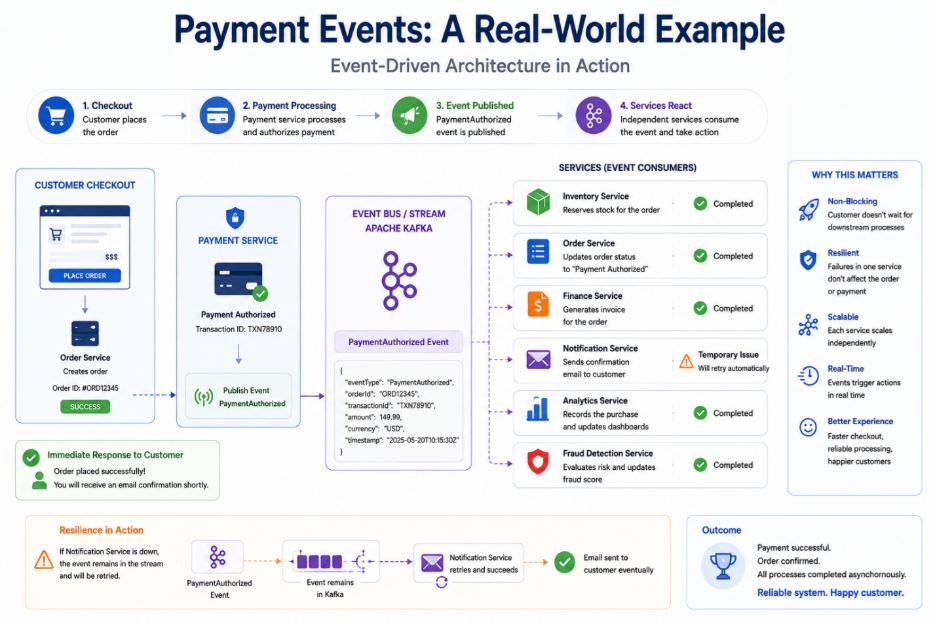
Retries should use exponential backoff, jitter, maximum-attempt limits and dead-letter queues. A repeated payment event must never create duplicate invoices or transactions.
8. Memory Leaks Quietly Reduce Throughput
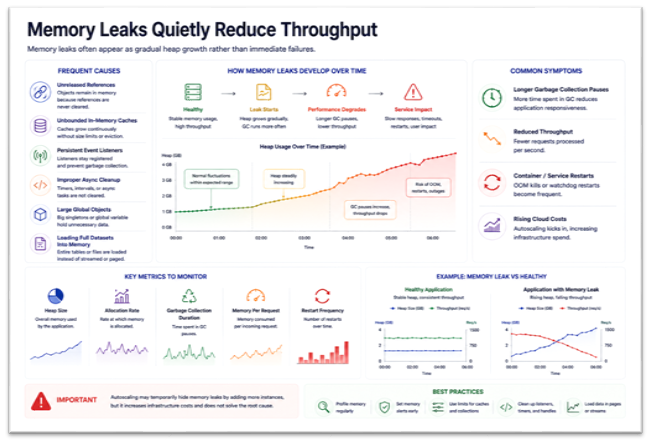
Frequent causes include:
- Unreleased references
- Unbounded in-memory caches
- Persistent event listeners
- Improper async cleanup
- Large global objects
- Loading full datasets into memory
Symptoms include longer garbage-collection pauses, reduced throughput, container restarts and rising cloud costs.
Monitor heap size, allocation rate, garbage-collection duration, memory per request and restart frequency. Autoscaling may temporarily hide the problem while increasing infrastructure spend.
9. Queue Failures Break Distributed Workflows
Queues often fail silently while applications continue accepting requests.
Risks include:
- Consumer lag
- Poison messages
- Duplicate delivery
- Unbounded retries
- Queue starvation
- Incorrect acknowledgements
- Missing backpressure
Track queue depth, message age, retry volume and consumer throughput. Use dead-letter queues, poison-message isolation, retry limits, consumer autoscaling, idempotent handlers and recovery procedures.
Publishing a message confirms delivery to the broker—not completion of the business process.
Performance Engineering Must Be Continuous
Backend optimization is not a one-time pre-release task. Teams should continuously monitor:
- Query count and execution time
- p95 and p99 API latency
- Cache hit ratio
- Connection-pool wait time
- Queue depth and message age
- Heap and garbage collection
- Retry frequency
- AI token usage and inference latency
- Cost per transaction
Scalable platforms are not built by adding larger servers whenever performance drops. They are built through profiling, observability, failure isolation, backpressure and disciplined architecture.